Knowledge graphs in private credit (part 2 of 5) ·
We built a cross-lender borrower graph from 5,867 BDC holdings
Using SEC schedule-of-investments data for seven reconciled BDCs at 6/30/2026, we built a small networkx graph of BDCs and borrowers. After filtering, 208 of 2,034 approximately matched borrowers are held by two or more of the seven.
Part 1 argued that private credit exposure lives in the links. This piece puts that to work on public data: one quarter of BDC schedules of investments, loaded as a graph, with every number computed from the data.
The data
The source is the SEC's structured BDC data sets, the schedule-of-investments table (soi.tsv) from the 2026_07 and 2026_08 monthly sets (SEC BDC Data Sets). We used the 10-Q for the period ended 6/30/2026 for seven BDCs: ARCC, BCRED, FSK, GBDC, HTGC, MAIN and OBDC. After removing subtotal, cash and JV look-through rows, the extract has 5,867 holding rows, and each of the seven reconciles to its 10-Q total cost and fair value within ±0.5%.
How FSK and GBDC reconcile. An earlier version of this article left both out because their totals were off. FSK prints each unfunded commitment as its own row at gross value and nets $1.1bn of them only in three subtotal lines; we net the same amounts from FSK's totals and tag the 199 unfunded rows. GBDC tags seven current-period lines without an identifier, so the standard filter dropped them; we add them from the 10-Q. Details are on the methodology page.
Filtering
From the 5,867 rows:
| Step | Rows |
|---|---|
| Removed: identifiable equity, warrants, preferred, units, LP and LLC interests, fund investments | 1,263 |
| Removed: FSK unfunded commitments (not funded holdings) | 199 |
| Kept | 4,407 |
The filings don't describe instruments the same way. ARCC, GBDC, HTGC, MAIN and OBDC put the instrument type in the identifier ("First lien senior secured loan", "One stop", "Secured Debt"), so we can confirm almost all of those rows are debt. BCRED and FSK identifiers mostly don't: 1,088 of BCRED's 1,139 kept rows and 264 of FSK's 288 are "untyped." They passed the equity filter, but we can't positively confirm they are debt from the identifier alone. That's why this article says holdings, not loans. The structured file had no per-holding industry field for these filers, so industry comes from identifier text only where it appears (HTGC and FSK).
Shared-borrower count. One method is used everywhere on privatecredittech.com (articles, cards, posts): start from the 30 Jun 2026 holdings of ARCC, BCRED, FSK, GBDC, HTGC, MAIN and OBDC; keep debt holdings only (drop cash, subtotals, JV interests, and identifiable equity, warrants, preferred, units, LP, LLC and fund interests); drop FSK's unfunded-commitment rows; normalize borrower names (lowercase, strip punctuation and legal/holding-company words such as Inc, LLC, Holdings, Parent, Topco, Bidco, Acquisition); then count normalized borrowers held by two or more BDCs. Result: 208 of 2,034 borrowers. Name matching is approximate, and most BCRED and FSK rows don't name the instrument type, so they are kept because they didn't match the equity filter.
The graph
Verified example
- Lender / BDC
- Borrower
- Filing
Before: scattered rows
| Where it sits | Row text (as filed) | FV ÷ cost |
|---|---|---|
| ARCC 10-Q, Schedule of Investments | Hyland Software, Inc. | First lien senior secured loan | 100.8% |
| OBDC 10-Q, Schedule of Investments | Hyland Software, Inc | First lien senior secured loan | Non-Affiliated | 97.0% |
| GBDC 10-Q, Schedule of Investments | Hyland Software, Inc. | One stop 1 | Non-Affiliated Issuer | 96.3% |
Three filings, name strings that don’t match exactly, two different tranche labels. Nothing in the rows says they are the same company.
Question the graph answers
Which lenders share this borrower, and who marks it lowest?
One hop from Hyland Software: ARCC, OBDC and GBDC. Lowest mark: GBDC at 96.3% of cost. Two hops: the filing behind each mark.
We used Python and networkx. Nodes:
- 7 BDC nodes
- 2,034 borrower nodes, after name normalization (lowercase; strip punctuation; drop suffixes such as Inc, LLC, LP, Ltd, Corp, Holdings, HoldCo, Intermediate, Parent, TopCo, MidCo, BidCo, Buyer, Acquisition, Group)
- 37 industry nodes (HTGC and FSK only)
Edges:
- BDC–borrower edges, each carrying summed fair value, summed cost and the number of underlying rows
- borrower–industry edges where an industry was available
Total: 2,078 nodes and 2,626 edges.
Name matching is approximate. The normalization merges real variants (ZenDesk / Zendesk / Zendesk Inc; Bamboo US BidCo / Bamboo US BidCo LLC / Bamboo US Bidco). It also collapses distinct legal entities in one capital structure (Denali Bidco, Denali Holdco, Denali Intermediate Holdings and Denali TopCo all become one node; Integrity Marketing Acquisition and Integrity Marketing Group LLC merge too). It will miss matches where names differ by more than a suffix. Across the graph, 82 borrower nodes were formed from more than one raw name string. We did not hand-review matches.
What the graph shows
Most borrowers belong to one BDC; a minority are shared
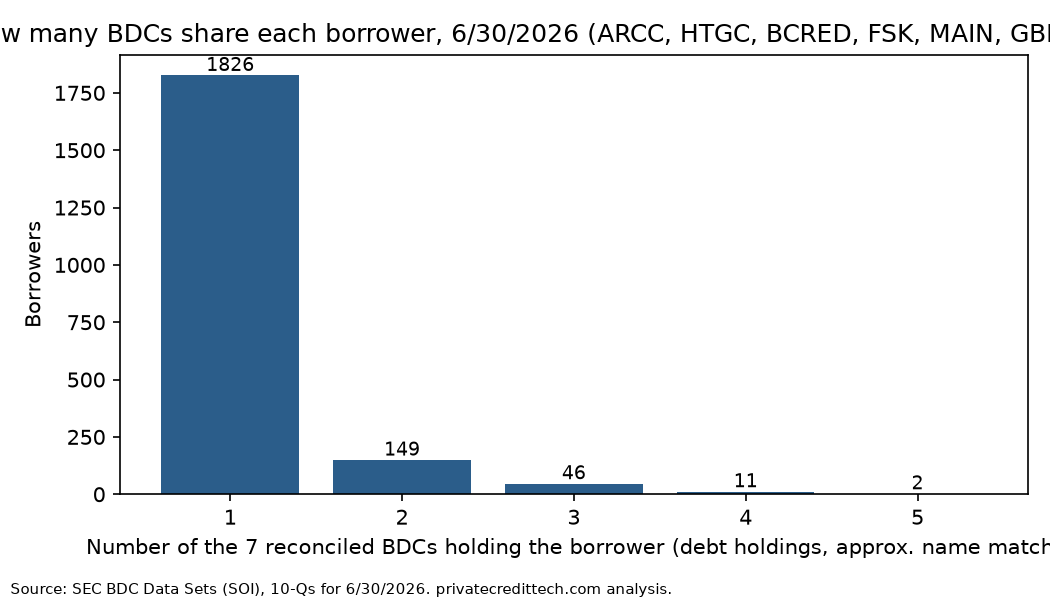
| Held by | Borrowers |
|---|---|
| 1 BDC | 1,826 |
| 2 BDCs | 149 |
| 3 BDCs | 46 |
| 4 BDCs | 11 |
| 5 BDCs | 2 |
| 2 or more | 208 |
So 208 of 2,034 borrowers (about 10%) sit in two or more of these seven portfolios, and 13 sit in four or more. By value, BDC–borrower edges to shared borrowers carry $39.7bn of the $135.9bn total fair value in the filtered graph (about 29%), because the shared names tend to be larger, sponsor-backed credits. BCRED alone is $74.1bn of that total, so the dollar split leans heavily on one portfolio.
The most-shared names
Two borrowers are held by five of the seven BDCs: Zendesk and Flexera Software (ARCC, BCRED, FSK, GBDC, OBDC). The most-shared names, then by combined fair value:
| Borrower (as labeled) | # BDCs | Held by | Combined FV ($m) |
|---|---|---|---|
| Zendesk | 5 | ARCC, BCRED, FSK, GBDC, OBDC | 1,360.8 |
| Flexera Software | 5 | ARCC, BCRED, FSK, GBDC, OBDC | 471.7 |
| Anaplan | 4 | ARCC, BCRED, GBDC, OBDC | 738.0 |
| Denali TopCo (family, see caveat) | 4 | ARCC, BCRED, GBDC, OBDC | 623.0 |
| Severin Acquisition | 4 | ARCC, BCRED, GBDC, OBDC | 556.2 |
| Integrity Marketing Group LLC (family, see caveat) | 4 | BCRED, FSK, GBDC, OBDC | 507.6 |
| Creek Parent | 4 | ARCC, BCRED, GBDC, OBDC | 503.0 |
| Bamboo US BidCo | 4 | ARCC, BCRED, GBDC, OBDC | 218.3 |
| Clearwater Analytics LLC (family, see caveat) | 4 | ARCC, FSK, GBDC, OBDC | 182.9 |
| Higginbotham Insurance Agency | 4 | ARCC, BCRED, FSK, GBDC | 145.6 |
The largest three-BDC names are IRI Group Holdings ($1,770.1m) and Auctane ($1,097.9m), both held by ARCC, BCRED and OBDC. The top of the list is mostly large software and services credits, which is consistent with how big club and unitranche deals get split across platforms. Industry tags exist only for HTGC and FSK, so 38 of the 208 shared names carry one (most often FSK's "Software & Services", 10); that is too few for an industry breakdown.
Which pairs of BDCs overlap
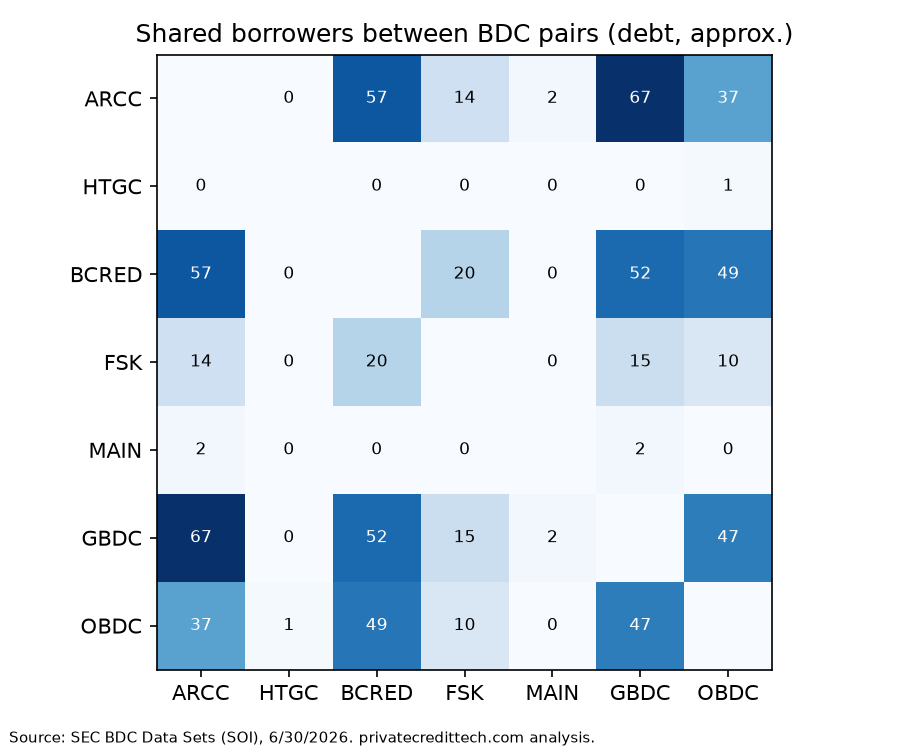
Projecting the graph onto BDC pairs (count of borrowers both hold):
- ARCC–GBDC: 67
- ARCC–BCRED: 57
- BCRED–GBDC: 52
- BCRED–OBDC: 49
- GBDC–OBDC: 47
- ARCC–OBDC: 37
- BCRED–FSK: 20
- FSK–GBDC: 15
- ARCC–FSK: 14
- FSK–OBDC: 10
- ARCC–MAIN: 2; MAIN–GBDC: 2; HTGC–OBDC: 1
- every other pair: 0
MAIN shares 3 borrowers with anyone, and HTGC shares 1 (with OBDC). That fits their strategies. MAIN focuses on lower-middle-market companies, and HTGC is a venture and growth lender with almost no names in common with sponsor-finance BDCs. In graph terms, there's a dense cluster (ARCC, BCRED, GBDC, OBDC), FSK attached to it more loosely, and two near-isolated nodes.
Per BDC, the share of borrowers that also appear in at least one other of the seven:
| BDC | Borrowers | Shared with ≥1 other | FV in shared names ($m) |
|---|---|---|---|
| ARCC | 508 | 121 | 5,873.2 |
| BCRED | 739 | 121 | 23,983.0 |
| GBDC | 378 | 119 | 2,597.7 |
| OBDC | 214 | 88 | 4,724.1 |
| FSK | 174 | 37 | 2,513.4 |
| MAIN | 166 | 3 | 23.7 |
| HTGC | 137 | 1 | 20.1 |
What this is useful for
- Secondaries and portfolio purchases. If you're bidding on a BDC-adjacent portfolio, the pairwise overlap tells you how much you already own. Run it against your own book instead of a peer's.
- CLO and fund overlap. Swap BDCs for CLOs and the same graph answers obligor-overlap questions (part 4).
- Watchlist contagion. When one of the 208 shared names gets marked down, you can see right away which other public lenders carry it and at what mark. Comparing marks across lenders on the same borrower is a natural next step that the edge attributes already support.
What we'd do next
- Add instrument types for BCRED and FSK rows from the 10-Q HTML, so untyped holdings can be confirmed as debt.
- Add a reviewed crosswalk (raw name → canonical entity → family) rather than suffix-stripping.
- Add sponsor nodes. That needs another source, because BDC schedules don't name the sponsor.
- Add per-holding marks (FV/cost) to compare how different lenders value the same credit.
The script is in the repo at articles/work/graph.py and the computed output in articles/work/stats.json. Every figure above comes from that run (16 Oct 2026, seven reconciled BDCs).
Sources
- www.sec.gov ↗ https://www.sec.gov/data-research/sec-markets-data/bdc-data-sets
- networkx.org ↗ https://networkx.org/
- www.sec.gov ↗ https://www.sec.gov/ix?doc=/Archives/edgar/data/1287750/000162828026050307/arcc-20260630.htm
- www.sec.gov ↗ https://www.sec.gov/ix?doc=/Archives/edgar/data/1396440/000139644026000094/main-20260630.htm
Educational content, not investment advice. Figures derived from SEC filings may contain errors: verify against the filing. Found an error? See the corrections log.